julia
using PalmerPenguins, DataFrames
using AlgebraOfGraphics
import AlgebraOfGraphics as AoG
using GLMakie
GLMakie.activate!()

function getPenguins()
    # ENV["DATADEPS_ALWAYS_ACCEPT"] = "true"
    penguins = dropmissing(DataFrame(PalmerPenguins.load()))
    return penguins
end

penguins = getPenguins()
p3d  = data(penguins)
p3d *= AoG.density()
p3d *= mapping(:bill_length_mm, :bill_depth_mm)
p3d *= visual(Wireframe, linewidth=0.05, transparency=true)
p3d *= mapping(color = :species);
Let's define 3 new default colors
julia
colors = tuple.([:grey10, :orange, :dodgerblue], 0.5)
palstyle = (; color=colors, patchcolor = colors);
Penguins 3d Wireframe density
julia
with_theme(theme_ggplot2(),size = (600,400), palette=palstyle) do
    draw(p3d; axis = (type = Axis3, perspectiveness = 0.5, aspect=(1, 1, 1)))
end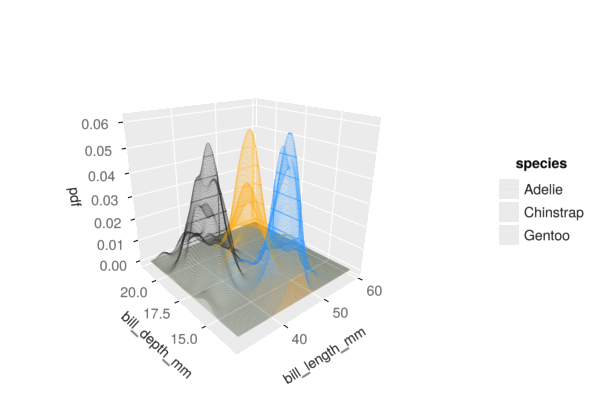
Penguins histogram
julia
phist = data(penguins)
phist *= AoG.histogram(; bins = 28)
phist *= mapping(:bill_length_mm => "bill length mm", color =:species, stack = :species);

with_theme(theme_ggplot2(),size = (600,400), palette=palstyle) do
    phist |> draw
end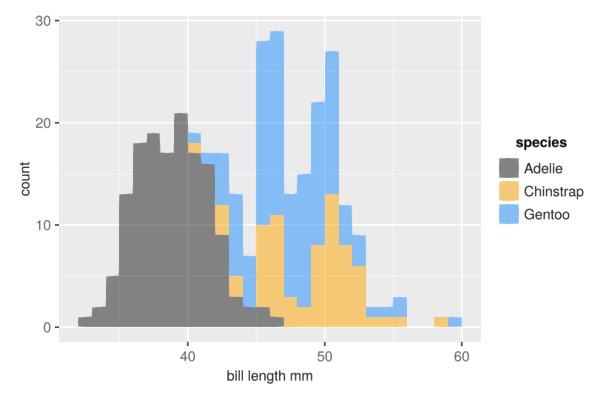
AoG and plain Makie
Currently, density plots with direction=:y is not supported by AoG, but you can just do it with plain Makie and combine everything into a nice layout.
julia
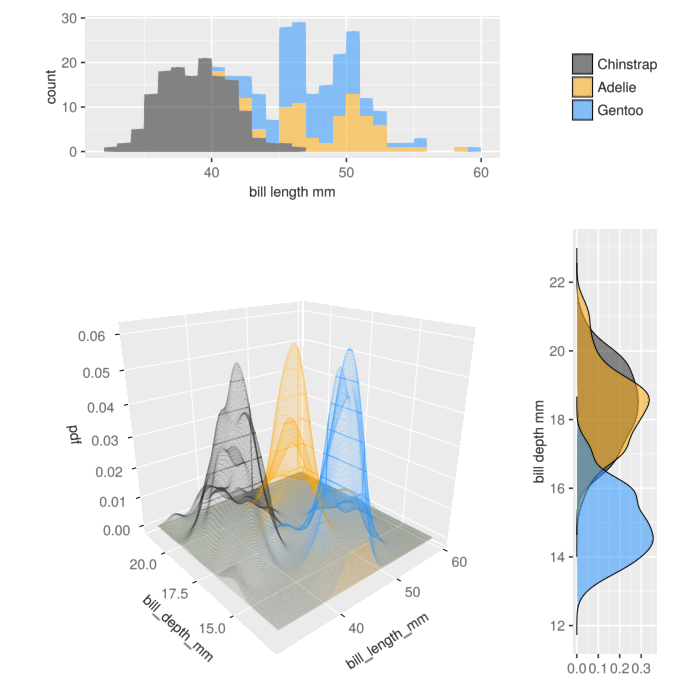
with_theme(theme_ggplot2(),size = (600,400), palette=palstyle) do
    pnames = ["Chinstrap", "Adelie","Gentoo"]
    bill_depths = [filter(:species => x -> x == n, penguins)[!,:bill_depth_mm] for n in pnames]

    fig = Figure(; size = (700, 700))
    draw!(fig[2,1], p3d; axis = (type = Axis3, perspectiveness = 0.5, aspect=(1, 1, 1)))
    draw!(fig[1,1], phist)
    # plain Makie
    axd = Axis(fig[2,2], ylabel = "bill depth mm")
    [density!(axd, b_depth, direction = :y, strokewidth = 1, label = pnames[i])
        for (i,b_depth) in enumerate(bill_depths)]
    Legend(fig[1,2], axd, tellheight = true)
    # some extra tweaks
    colsize!(fig.layout, 1, Relative(3/4))
    rowsize!(fig.layout, 1, Relative(1/4))
    rowgap!(fig.layout,0)
    colgap!(fig.layout,0)
    fig
end