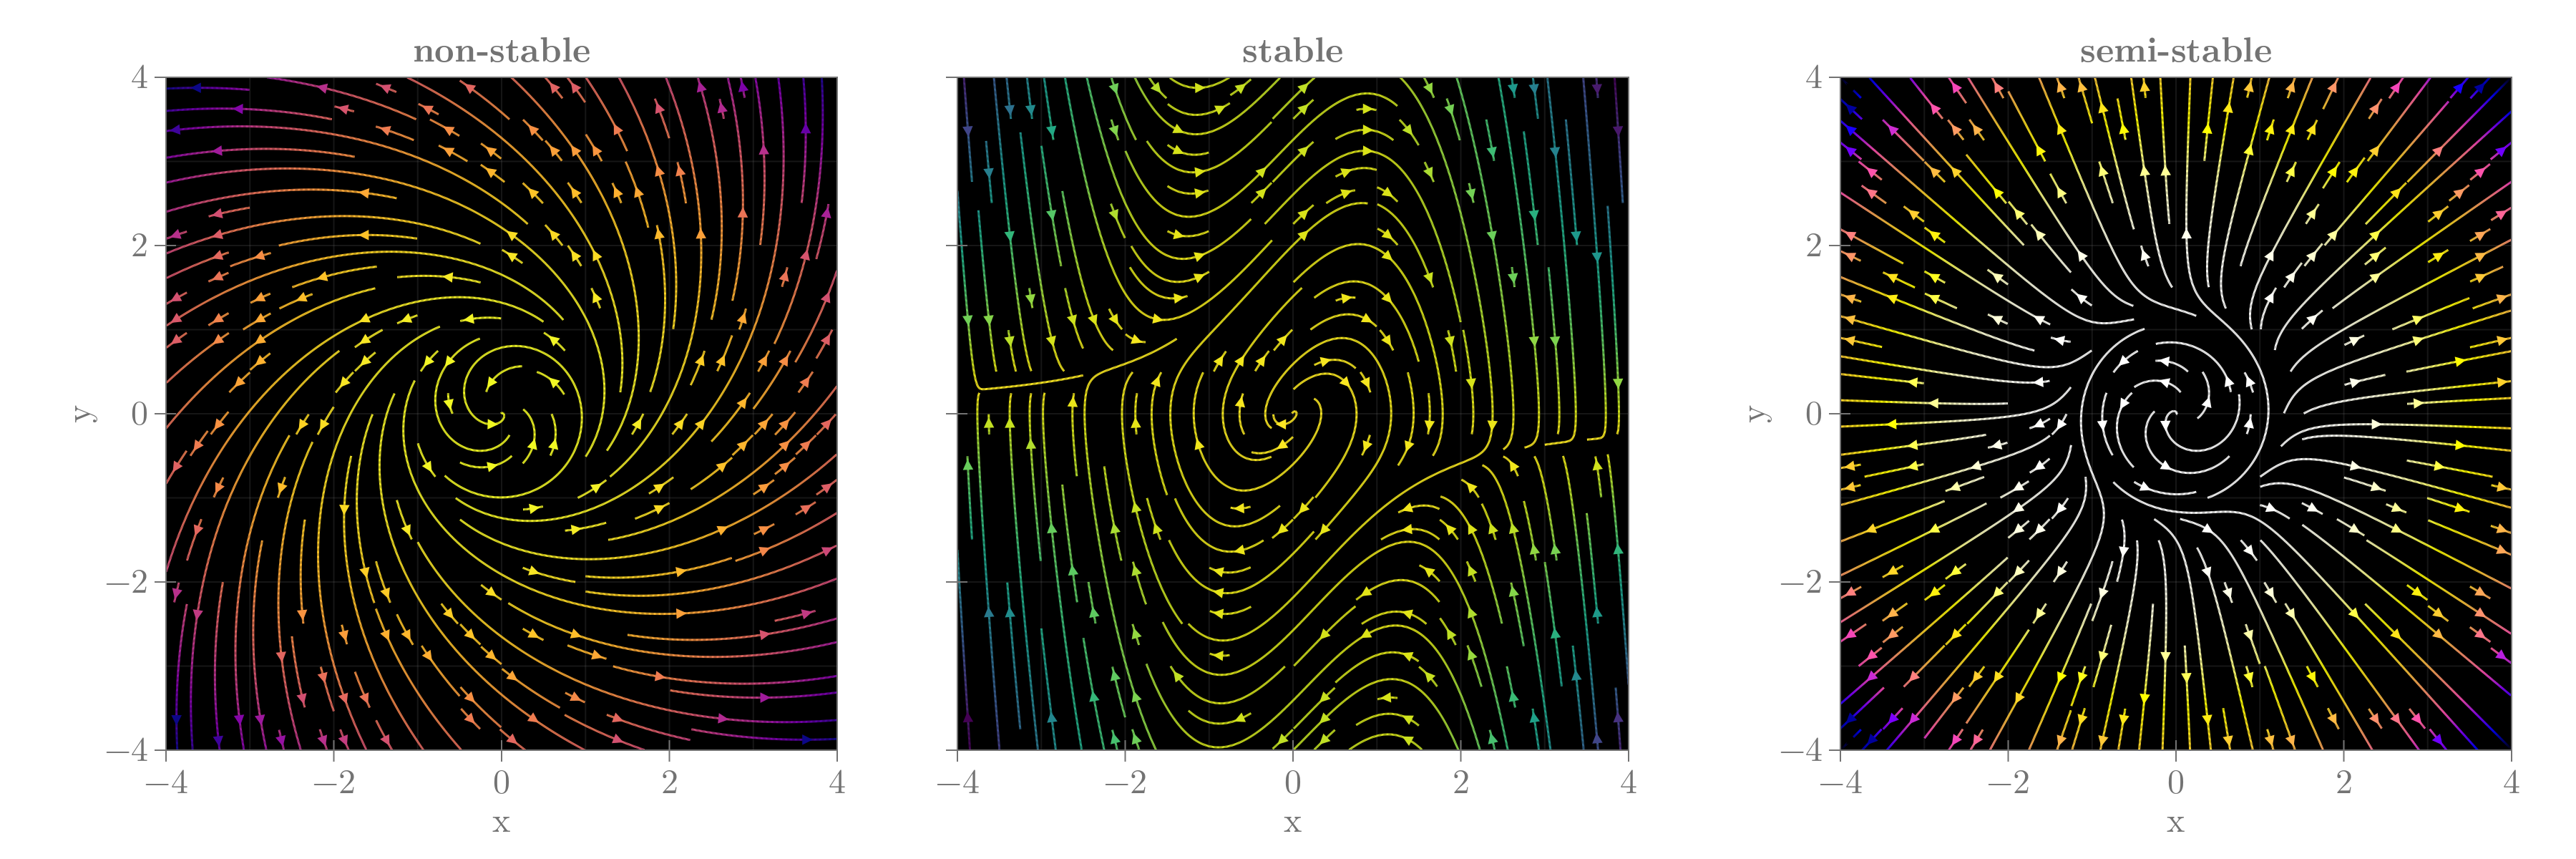
streamplot: Poincare and Van der Paul
julia
using CairoMakie

nonStablePoincare(x, y) = Point2f(x * (x^2 + y^2 - 1) - y * (x^2 + y^2 + 1), y * (x^2 + y^2 - 1) + x * (x^2 + y^2 + 1))
stableVanDerPaul(x, y) = Point2f(y, (1 - x^2) * y - x)
semiStable(x, y) = Point2f(-y + x * (-1 + x^2 + y^2)^2, x + y * (-1 + x^2 + y^2)^2)
titles = ["non-stable", "stable", "semi-stable"]
functions = [nonStablePoincare, stableVanDerPaul, semiStable]
cmaps = [:plasma, :viridis, :gnuplot2]

fig = Figure(size = (1800, 600), fontsize = 24)
axs = [Axis(fig[1, i], xlabel = "x", ylabel = "y", title = titles[i],
    aspect = 1, backgroundcolor = :black) for i in 1:3]
[streamplot!(axs[i], functions[i], -4 .. 4, -4 .. 4, colormap = Reverse(cmaps[i]),
    gridsize = (32, 32), arrow_size = 10) for i in 1:3]
[hideydecorations!(axs[2], grid = false, ticks = false) for i in 2:3]
[limits!(axs[i], -4, 4, -4, 4) for i in 1:3]
fig