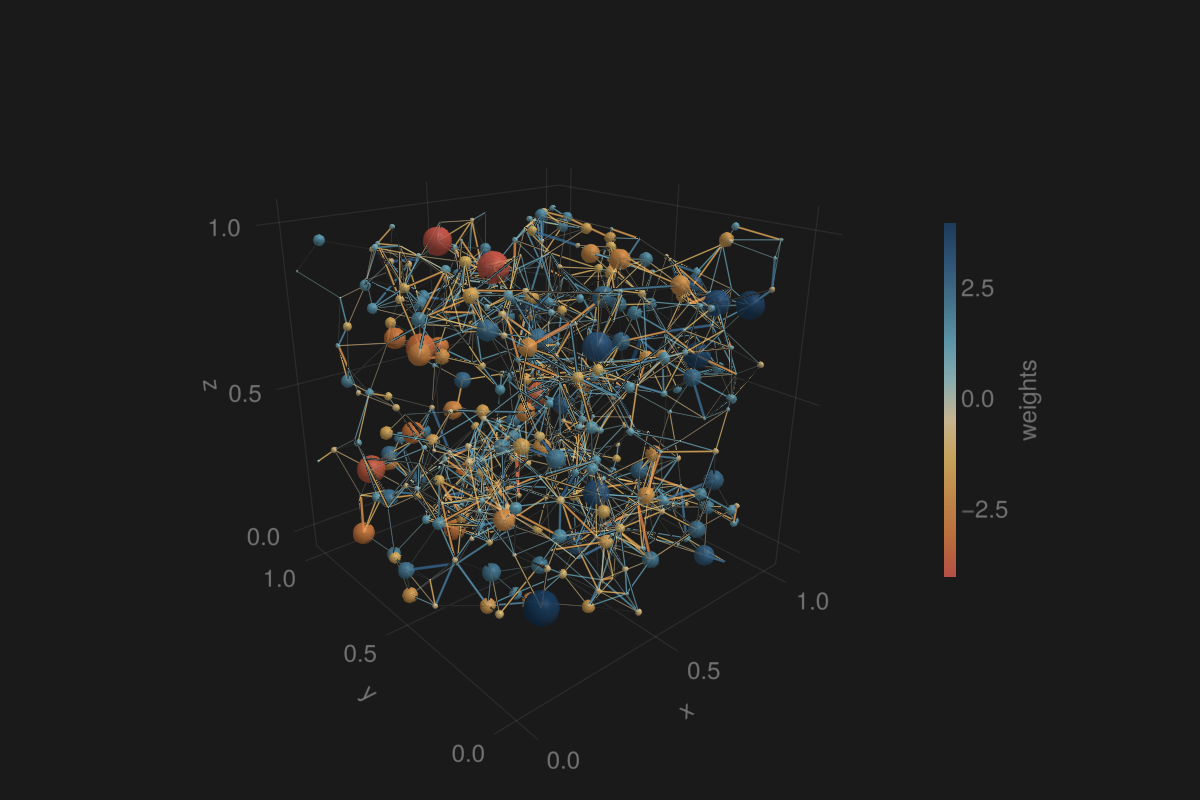
Random Rectangular Graph
julia
# Adaptation from:
# L Alonso, et. al. https://doi.org/10.1093/comnet/cnx053

using LinearAlgebra, Random, GLMakie
GLMakie.activate!()
GLMakie.closeall() # close any open screen

function RRGAdjacencyM3D(; radius = 0.17, nodes = 500, rseed = 123)
    Random.seed!(rseed)
    xy = rand(nodes, 3)
    x = xy[:, 1]
    y = xy[:, 2]
    z = xy[:, 3]

    matrixAdjDiag = Diagonal(√2 * randn(nodes))
    matrixAdj = zeros(nodes, nodes)
    for point in 1:nodes-1
        xseps = (x[point+1:end] .- x[point]) .^ 2
        yseps = (y[point+1:end] .- y[point]) .^ 2
        zseps = (z[point+1:end] .- z[point]) .^ 2

        distance = sqrt.(xseps .+ yseps .+ zseps)
        dindx = findall(distance .<= radius) .+ point
        if length(dindx) > 0
            rnd = randn(length(dindx))
            matrixAdj[point, dindx] = rnd
            matrixAdj[dindx, point] = rnd
        end
    end
    return (matrixAdj .+ matrixAdjDiag, x, y, z)
end
adjacencyM3D, x, y, z = RRGAdjacencyM3D()

function getGraphEdges3D(adjMatrix3D, x, y, z)
    xyzos = []
    weights = []
    for i in eachindex(x), j in i+1:length(x)
        if adjMatrix3D[i, j] != 0.0
            push!(xyzos, [x[i], y[i], z[i]])
            push!(xyzos, [x[j], y[j], z[j]])
            push!(weights, adjMatrix3D[i, j])
            push!(weights, adjMatrix3D[i, j])
        end
    end
    return (Point3f.(xyzos), Float32.(weights))
end

function plotGraph3D(adjacencyM3D, x, y, z)
    cmap = (:Hiroshige, 0.75)
    adjmin = minimum(adjacencyM3D)
    adjmax = maximum(adjacencyM3D)
    diagValues = diag(adjacencyM3D)
    segm, weights = getGraphEdges3D(adjacencyM3D, x, y, z)

    fig, ax, pltobj = linesegments(segm; color = weights, colormap = cmap,
        linewidth = abs.(weights),
        colorrange = (adjmin, adjmax),
        figure = (;
            size = (1200, 800),
            fontsize = 24),
        axis = (;
            type = Axis3,
            aspect = (1, 1, 1),
            perspectiveness = 0.5))
    meshscatter!(ax, x, y, z; color = diagValues,
        markersize = abs.(diagValues) ./ 90,
        colorrange = (adjmin, adjmax),
        colormap = cmap)
    Colorbar(fig[1, 2], pltobj, label = "weights", height = Relative(0.5))
    colsize!(fig.layout, 1, Aspect(1, 1.0))
    fig
end
with_theme(theme_dark()) do
    plotGraph3D(adjacencyM3D, x, y, z)
end