Earthquakes and GeoMakie
julia
using GLMakie, GeoMakie
using AlgebraOfGraphics, DataFrames, CSV
using FileIO, Downloads
GLMakie.activate!()
urldata = "https://raw.githubusercontent.com/MakieOrg/BeautifulMakie/main/data/"
file1 = Downloads.download(urldata * "2021_01_2021_05.csv")
file2 = Downloads.download(urldata * "2021_06_2022_01.csv")
earthquakes1 = CSV.read(file1, DataFrame)
earthquakes2 = CSV.read(file2, DataFrame)
df = vcat(earthquakes1, earthquakes2)
mn = minimum(exp.(df[!, :mag]))
mx = maximum(exp.(df[!, :mag]) .- minimum(exp.(df[!, :mag])))
snew = sort(df, :mag, rev=true)
n15 = first(snew, 15)
n15[!, :n] = 1:15
n15[!, :x] .= 0.0
p = data(df) * mapping(:longitude, :latitude, color = :mag,
markersize=:mag =>(t->50(exp(t)-mn)/mx)) *
visual(Scatter, colormap = Reverse(:Hiroshige))
plt = data(n15) * mapping(:n, :depth, color=:mag, text = :place => verbatim) *
visual(BarPlot, direction=:x, width=0.45,
colormap = :cyclic_tritanopic_cwrk_40_100_c20_n256)
ptxt = data(n15) * mapping(:x, :n=>(t->t+0.25), text = :place => verbatim) *
visual(Makie.Text, align = (:left, :bottom))
with_theme(theme_dark(), size = (1400,800)) do
fig = Figure()
gax = GeoAxis(fig[1,2]; aspect = 1, dest = "+proj=eqdc +lat_1=90 +lat_2=90")
axlocs = Axis(fig[1,1], xlabel = "depth [km]", ylabel = "magnitude")
lines!(gax, GeoMakie.coastlines(), color=:papayawhip, linewidth=0.5)
# obj = draw!(gax, p)
obj = scatter!(gax, df[!, :longitude], df[!, :latitude];
color = df[!, :mag], colormap = Reverse(:Hiroshige),
markersize = 50*(exp.(df[!, :mag]) .- mn)/mx )
Colorbar(fig[1,3], obj)
draw!(axlocs, plt)
draw!(axlocs, ptxt)
axlocs.yticks = (1:15, string.(n15[!, :mag]))
colsize!(fig.layout, 1, Auto(0.5))
colgap!(fig.layout,0)
hidespines!(axlocs, :r, :t)
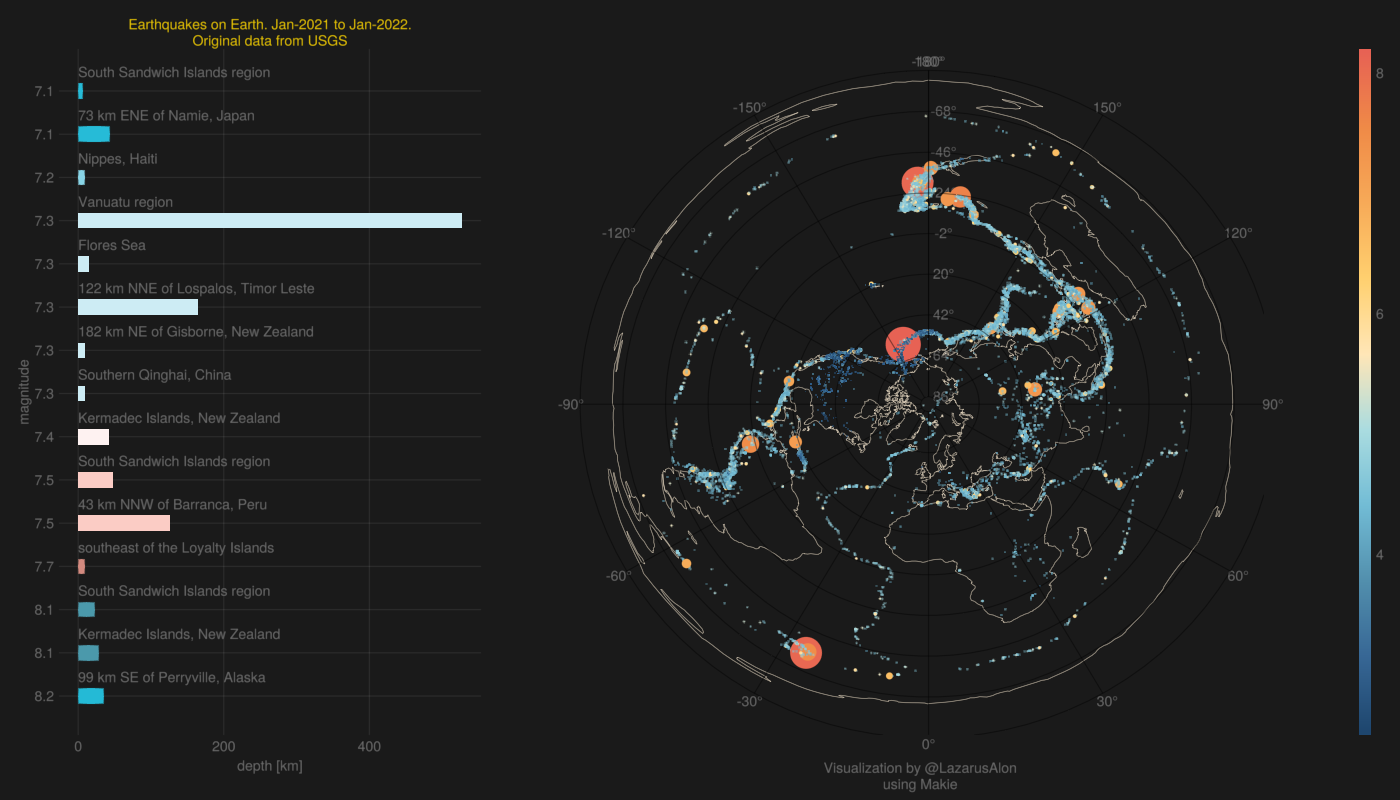
Label(fig[1, 2, Bottom()], "\n\nVisualization by @LazarusAlon\nusing Makie")
Label(fig[1, 1, Top()],
"Earthquakes on Earth. Jan-2021 to Jan-2022.\nOriginal data from USGS",
color = :gold)
fig
end
save("newEntryAoG_Geomakie.png", current_figure())