Here, we reproduce the outputs from this link: https://examples.pyviz.org/attractors/attractors.html
Strange attractors
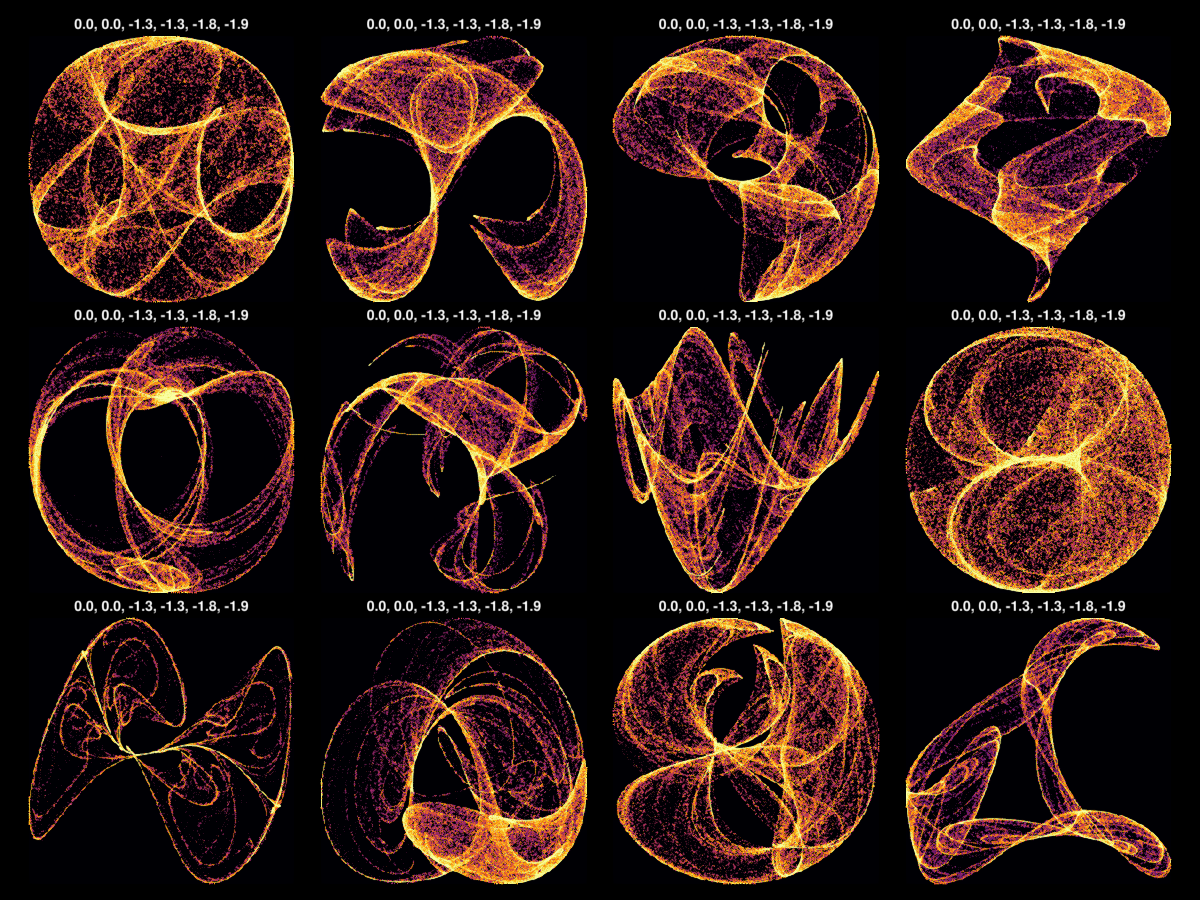
An attractor is a set of values to which a numerical system tends to evolve. An attractor is called a strange attractor if the resulting pattern has a fractal structure.
In order to achieve the desire output we just need the following functions.
julia
using GLMakie, StatsBase, OnlineStats
using LinearAlgebra, Interpolations
GLMakie.activate!()
Trajectory
julia
function trajectory(fn, x0, y0, kargs; n = 1000) #  kargs = a, b, c, d
    x, y = zeros(n+1), zeros(n+1)
    x[1], y[1] = x0, y0
    for i = 1:n
        x[i+1], y[i+1] = fn(x[i], y[i], kargs...)
    end
    x, y
end
trajectory (generic function with 1 method)Aggregation
julia
function aggHist(x, y; nbinsx = 400, nbinsy = 400)
    xedges = range(extrema(x)..., length = nbinsx)
    yedges = range(extrema(y)..., length = nbinsy)
    o = fit!(HeatMap(xedges, yedges), zip(x, y))
    return o
end
aggHist (generic function with 1 method)Equalization
julia
function eq_hist(matrix; nbins = 256 * 256)
    h_eq = fit(Histogram, vec(matrix), nbins = nbins)
    h_eq = normalize(h_eq, mode = :density)
    cdf = cumsum(h_eq.weights)
    cdf = cdf / cdf[end]
    edg = h_eq.edges[1]
    interp_linear = LinearInterpolation(edg, [cdf..., cdf[end]])
    out = reshape(interp_linear(vec(matrix)), size(matrix))
    return out
end
eq_hist (generic function with 1 method)Clifford
julia
function Clifford(x, y, a, b, c, d)
    sin(a * y) + c * cos(a * x), sin(b * x) + d * cos(b * y)
end
Clifford (generic function with 1 method)Some interesting values
julia
cargs = [[0, 0, -1.3, -1.3, -1.8, -1.9],
    [0, 0, -1.4, 1.6, 1.0, 0.7],
    [0, 0, 1.7, 1.7, 0.6, 1.2],
    [0, 0, 1.7, 0.7, 1.4, 2.0],
    [0, 0, -1.7, 1.8, -1.9, -0.4],
    [0, 0, 1.1, -1.32, -1.03, 1.54],
    [0, 0, 0.77, 1.99, -1.31, -1.45],
    [0, 0, -1.9, -1.9, -1.9, -1.0],
    [0, 0, 0.75, 1.34, -1.93, 1.0],
    [0, 0, -1.32, -1.65, 0.74, 1.81],
    [0, 0, -1.6, 1.6, 0.7, -1.0],
    [0, 0, -1.7, 1.5, -0.5, 0.7]
]

with_theme(theme_black()) do
    fig = Figure(size = (1200,900))
    axs = [Axis(fig[i,j], aspect=1) for i in 1:3 for j in 1:4]
    for i in 1:12
        x, y = trajectory(Clifford, cargs[i][1:2]..., cargs[i][3:end]; n = 100_000)
        o = aggHist(x, y; nbinsx = 300, nbinsy = 300)
        m = eq_hist(o.counts)
        heatmap!(axs[i], o.xedges, o.yedges, m; colormap = :inferno)
        axs[i].title = join(string.(cargs[1]), ", ")
    end
    hidedecorations!.(axs)
    hidespines!.(axs)
    rowgap!(fig.layout,5)
    colgap!(fig.layout,1)
    fig
end