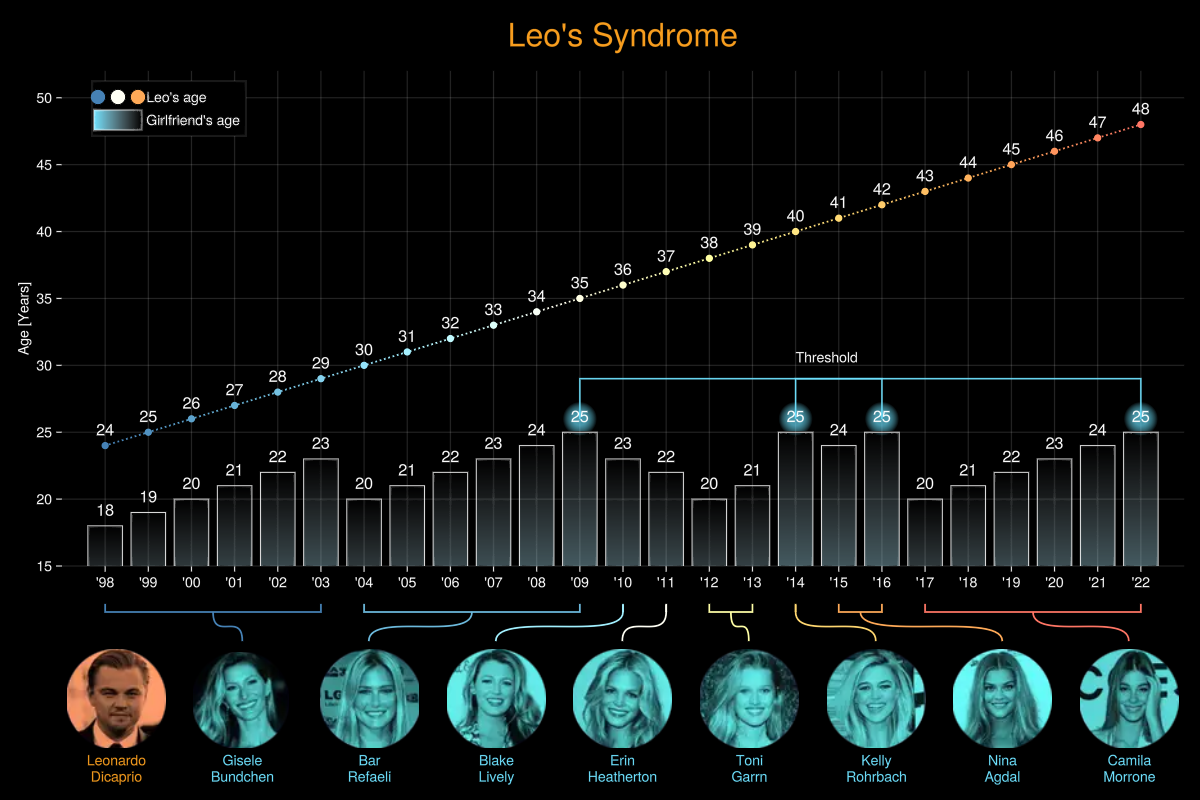
Leos

julia
using Downloads, GLMakie
using Colors, Statistics
using FileIO
GLMakie.activate!()
# some data
names = ["Leonardo Dicaprio", "Gisele Bundchen", "Bar Refaeli",
        "Blake Lively", "Erin Heatherton", "Toni Garrn", "Kelly Rohrbach",
        "Nina Agdal", "Camila Morrone"]
namesfiles = join.(split.(lowercase.(names)), "_")

y_xticks = 1998:2022
ys_xticks = string.(1998:2022)
yd_xticks = ["'"*t[3:4] for t in ys_xticks]
age_leo = 24 .+ collect(1:length(y_xticks)) .- 1

age_gf = [18:23, 20:25, 23, 22, 20:21,25, 24:25, 20:25]
years = [1998:2003, 2004:2009, 2010, 2011, 2012:2013, 2014,
    2015:2016, 2017:2022]
# helper functions
# Inspired by https://github.com/tashapiro/tanya-data-viz/tree/main/dicaprio-gfs
function getPicture(; name = "leonardo_dicaprio",
        imgs_link = "https://raw.githubusercontent.com/tashapiro/tanya-data-viz/main/dicaprio-gfs/images/")
    load(Downloads.download(joinpath(imgs_link, name * ".png")))
end
function poly3(t, p0, p1, p2, p3)
    Point2f((1-t)^3 .* p0 .+ t*p1*(3*(1-t)^2) + p2*(3*(1-t)*t^2) .+ p3*t^3)
end
function BezierPath(o, f, co, cf; t = range(0,1, length=30))
    return [poly3(t, o, co, cf, f) for t in t]
end
function posFig(ax, x; yoff=100, ylow = 15)
    o = ax.scene.viewport[].origin - Point2f(0, yoff)
    return Makie.project(ax.scene, Point2f(x, ylow)) + o
end
function supLine(p1, p2; x=0,y=8)
    [p1 .+ Point2f(x,y), p1, p2, p2 .+ Point2f(x,y)]
end

pictures = [getPicture(; name = n) for n in namesfiles]
cmap = resample_cmap(Reverse(:Hiroshige), 9)
blue = colorant"#6EE2FFFF";
grey = colorant"#D0DFE699";
# αcolors = [blue, grey, (grey, 0.1), (blue,0.65)] # try this one 😄
αcolors = [blue, blue, (grey, 0.0), (grey,0.0)]
αcolorsLeg = [blue, (grey, 0.0), (grey,0.0), blue]

legleo = MarkerElement(color =1.2cmap[2:3:end], marker = :circle, markersize = 20,
        points = Point2f[(0, 0.5), (1, 0.5), (2, 0.5)])
leggirl = PolyElement(color = αcolorsLeg, strokecolor = :white, strokewidth = 0.85,
    points = Point2f[(-0.2, 0), (2.2, 0), (2.2,1), (-0.2, 1)])

with_theme(theme_black()) do
    fig = Figure(; size = (1200,800))
    ax = Axis(fig[1,1:9], ylabel = "Age [Years]", xlabel = "")
    lines!(ax, y_xticks, age_leo; label = "Leo's age", color = age_leo,
        linestyle = :dot, colormap = 1.2cmap[2:end])
    scatter!(ax, y_xticks, age_leo; label = "Leo's age", color = age_leo,
        markersize = 10, colormap = 1.2cmap[2:end])
    [barplot!.(years[i], age_gf[i]; color = αcolors,label = "Girlfriend's age",
        strokewidth=0.85, strokecolor= (:white,1)) for i in eachindex(years)]
    [scatter!(ax, [2009,2014, 2016, 2022], fill(25 +1,4);
        color = (blue, 0.1), markersize = 50-3i) for i in 1:10]
    lines!(ax,supLine(Point2f(2009,29), Point2f(2022,29); x=0,y=-3); color=blue)
    lines!(ax,supLine(Point2f(2014,29), Point2f(2016,29); x=0,y=-3); color=blue)
    text!(ax, "Threshold", position = (2014,30))
    [text!(string.(age_gf[i]), position = Point2f.(years[i], age_gf[i] .+0.5),
        align = (:center, :bottom), fontsize = 16) for i in eachindex(age_gf)]
    text!(string.(age_leo), position = Point2f.(y_xticks, age_leo .+0.5),
        align = (:center, :bottom), fontsize = 16)
    ax.xticks = (y_xticks, yd_xticks)
    ax.yticks = 0:5:55
    ylims!(ax,15,52)
    xlims!(ax,1997,2023)
    hidespines!.(ax)
    # pictures
    aximgs = [Axis(fig[2,i], aspect = 1, xlabel = join(split(names[i]), "\n"),
        xlabelcolor = blue) for i in 1:9]
    [image!(aximgs[i], rotr90(pictures[i])) for i in eachindex(pictures)]
    hidedecorations!.(aximgs; label =false)
    hidespines!.(aximgs)
    aximgs[1].xlabelcolor = "#F79D1EFF"
    limits!.(aximgs,1,78,1,78)
    # connecting lines in fig space!
    ops = [posFig(ax, mean(years[i]); yoff=250, ylow = 15) for i in 1:8]
    fps = [posFig(aximgs[i], 39; yoff=120, ylow = 78) for i in 2:9]
    supls = [supLine(posFig(ax, years[i][begin]; yoff=250, ylow = 15),
        posFig(ax, years[i][end], yoff=250, ylow = 15)) for i in 1:8]
    [lines!(fig.scene, supls[k], color = 1.2cmap[k+1]) for k in 1:8]
    [lines!(fig.scene, BezierPath(ops[k], fps[k], [ops[k][1],ops[k][2]-30],
        [fps[k][1],fps[k][2]+30]); color = 1.2cmap[k+1]) for k in 1:8]
    rowsize!(fig.layout,2,Auto(0.2))
    rowgap!(fig.layout, 60)
    Legend(fig[1,1], [legleo, leggirl], ["      Leo's age", "      Girlfriend's age"],
        halign = :left, valign = :top,tellheight=false,tellwidth=false,
        margin = (30, 10, 10, 10), framecolor = (:white,0.2))
    Label(fig[0,:], "Leo's Syndrome", color = "#F79D1EFF", fontsize = 32)
    fig
end
WARNING: Constructor for type "BezierPath" was extended in `Main` without explicit qualification or import.
NOTE: Assumed "BezierPath" refers to `GLMakie.BezierPath`. This behavior is deprecated and may differ in future versions.`
NOTE: This behavior may have differed in Julia versions prior to 1.12.
Hint: If you intended to create a new generic function of the same name, use `function BezierPath end`.
Hint: To silence the warning, qualify `BezierPath` as `GLMakie.BezierPath` in the method signature or explicitly `import GLMakie: BezierPath`.