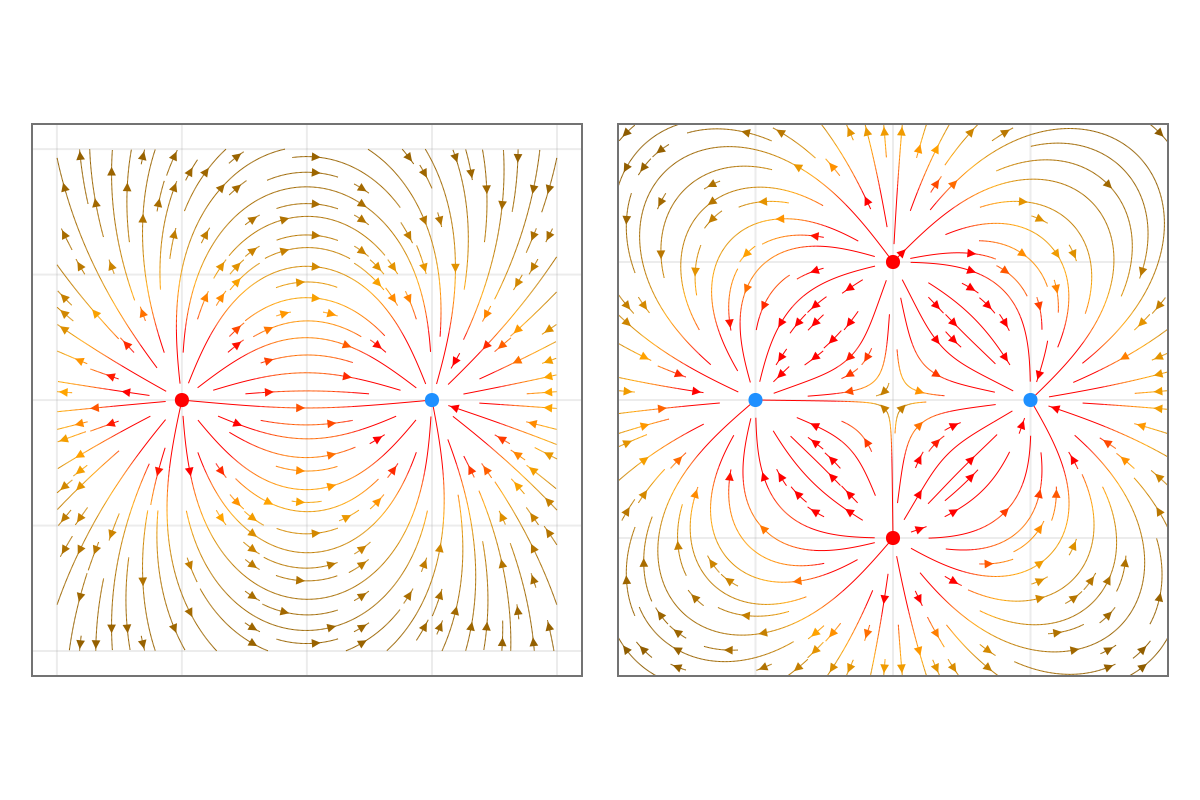
streamplot: Electric field lines
julia
using CairoMakie, LinearAlgebra

function E(q, rx, ry, x, y)
    d = sqrt((x-rx)^2 + (y-ry)^2)^3
    return (q * (x - rx) / d, q * (y - ry) / d)
end
function charges(; nq = 2)
    qs = []
    for i in 1:nq
        q = i % 2 * 2 - 1
        push!(qs, (q, cos(2π * i / nq), sin(2π * i / nq)))
    end
    qs
end
function fieldE(x,y)
    Ex, Ey = 0, 0
    for q in qs
        ex, ey = E(q..., x, y)
        Ex += ex
        Ey += ey
    end
    Point(Ex, Ey)
end

fig = Figure(size = (600,400))
ax1 = Axis(fig[1,1]; aspect = DataAspect())
ax2 = Axis(fig[1,2]; aspect = DataAspect())

qs = charges()
streamplot!(ax1, fieldE, -2..2, -2..2; arrow_size = 6, linewidth = 0.5,
    colorrange = (-3,3), colormap = ([:black, :black, :orange, :red]))
[scatter!(ax1, Point(qs[i][2:3]), color = qs[i][1] > 0 ? :red : :dodgerblue,
    markersize = 10) for i in eachindex(qs)]
qs = charges(; nq = 4)
streamplot!(ax2, fieldE, -2..2, -2..2; arrow_size = 6, linewidth = 0.5,
    colorrange = (-3,3), colormap = ([:black, :black, :orange, :red]))
[scatter!(ax2, Point(qs[i][2:3]), color = qs[i][1] > 0 ? :red : :dodgerblue,
    markersize = 10) for i in eachindex(qs)]
limits!(ax2, -2,2,-2,2)
hidedecorations!(ax1; grid = false)
hidedecorations!(ax2; grid = false)
fig