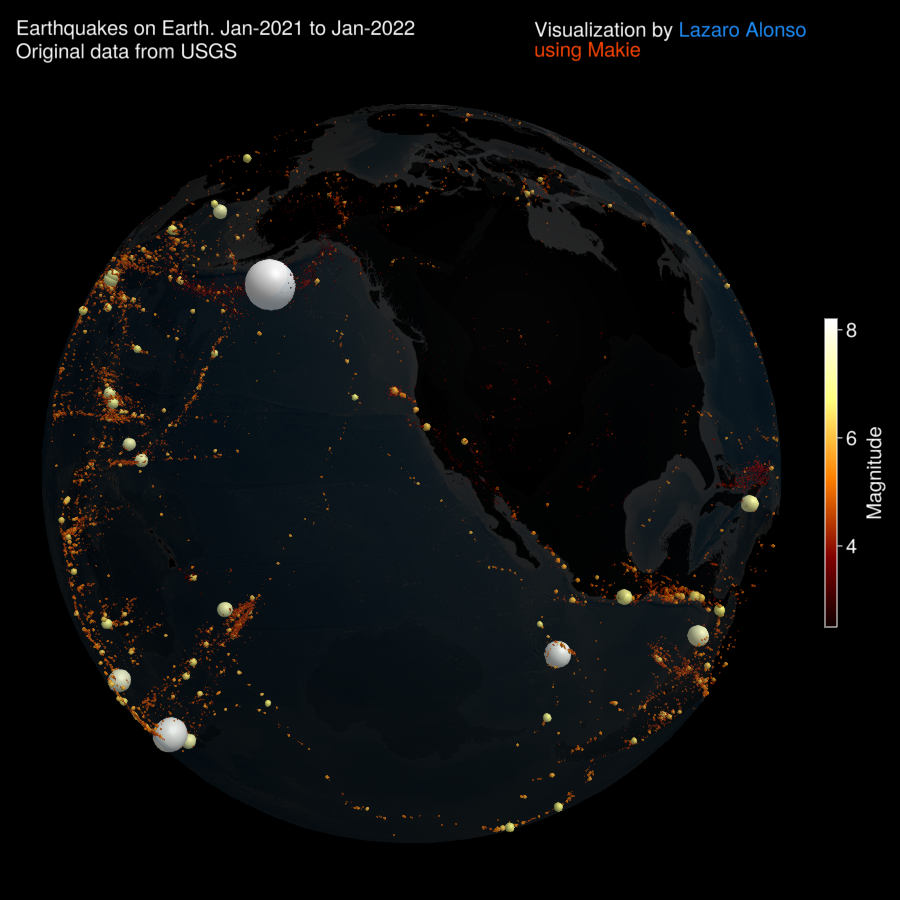
Earthquakes
julia
using CSV, DataFrames
using GLMakie, Colors, ColorSchemes
using FileIO, Downloads
GLMakie.activate!()
# Original reference: https://glowy-earthquakes.glitch.me

urlimg = "https://upload.wikimedia.org/wikipedia/commons/9/96/NASA_bathymetric_world_map.jpg"
earth_img = load(Downloads.download(urlimg))
function sphere(; r = 1.0, n = 32)
    θ = LinRange(0, π, n)
    φ = LinRange(-π, π, 2 * n)
    x = [r * cos(φ) * sin(θ) for θ in θ, φ in φ]
    y = [r * sin(φ) * sin(θ) for θ in θ, φ in φ]
    z = [r * cos(θ) for θ in θ, φ in φ]
    return (x, y, z)
end

# https://earthquake.usgs.gov/earthquakes/map/?extent=-68.39918,-248.90625&extent=72.60712,110.74219
urldata = "https://raw.githubusercontent.com/MakieOrg/BeautifulMakie/main/data/"
file1 = Downloads.download(urldata * "2021_01_2021_05.csv")
file2 = Downloads.download(urldata * "2021_06_2022_01.csv")
earthquakes1 = CSV.read(file1, DataFrame)
earthquakes2 = CSV.read(file2, DataFrame)
earthquakes = vcat(earthquakes1, earthquakes2)

# depth unit, km
function toCartesian(lon, lat; r = 1.02, cxyz = (0, 0, 0))
    x = cxyz[1] + (r + 1500_000) * cosd(lat) * cosd(lon)
    y = cxyz[2] + (r + 1500_000) * cosd(lat) * sind(lon)
    z = cxyz[3] + (r + 1500_000) * sind(lat)
    return (x, y, z) ./ 1500_000
end

lons, lats = earthquakes.longitude, earthquakes.latitude
depth = earthquakes.depth
mag = earthquakes.mag

toPoints3D = [Point3f([toCartesian(lons[i], lats[i];
    r = -depth[i] * 1000)...]) for i in eachindex(lons)]
ms = (exp.(mag) .- minimum(exp.(mag))) ./ maximum(exp.(mag) .- minimum(exp.(mag)))

with_theme(theme_black()) do
    fig = Figure(size = (900, 900), fontsize = 20)
    ax = LScene(fig[1, 1], show_axis = false)
    pltobj = meshscatter!(ax, toPoints3D; markersize = ms / 20 .+ 0.001, color = mag,
        colormap = resample_cmap(:afmhot, 256)[10:end], shading = FastShading,
        ambient = Vec3f(0.99, 0.99, 0.99))
    surface!(ax, sphere(; r = 1.0)..., color = tuple.(earth_img, 0.1),
        shading = FastShading, transparency = true)
    Colorbar(fig[1, 2], pltobj, label = "Magnitude", height = Relative(1.5 / 4))
    Label(fig[1, 1, Top()],
        rich("Visualization by ",
        rich("Lazaro Alonso\n", color=:dodgerblue),
        rich("using Makie", color=:orangered)),
        justification=:left,
        halign=1.0
        )
    Label(fig[1, 1, Top()], "Earthquakes on Earth. Jan-2021 to Jan-2022\nOriginal data from USGS",
        halign=0.0, justification=:left)
    zoom!(ax.scene, cameracontrols(ax.scene), 0.55)
    rotate!(ax.scene, 3.0)
    save("earthquakes.png", fig; update=false)
    ##run this to get a smooth animation
    record(fig, "earthquakes.mp4", framerate = 24, update=false) do io
        for i in 3.0:0.015:9.5
            rotate!(ax.scene, i)
            recordframe!(io)  # record a new frame
        end
    end
end
"earthquakes.mp4"