Astronauts
julia
using CairoMakie, HTTP, CSV, DataFrames, DataFramesMeta, Suppressor
using Images, ColorSchemes, Colors, Statistics
using Downloads
using Lazy: @>
CairoMakie.activate!(type = "png")
function plotastro()
data_url = "https://bit.ly/3kmlGn2"
@suppress begin
global astronauts
astronauts = CSV.File(HTTP.download(data_url)) |> DataFrame
end
offhr, rPts, α = 3.5, 45, 35
astro = @> begin
astronauts
@orderby(:year_of_mission)
@subset(:total_eva_hrs .> 0.0)
@transform(:ntotEVA = :total_eva_hrs / maximum(:total_eva_hrs))
@transform(:θ = LinRange(0, 2π - 2π / length(:name), length(:name)))
@transform(:align = tuple.(ifelse.(π / 2 .< :θ .< 3π / 2, ^(:right), ^(:left)), ^(:center)))
@transform(:texttheta = ifelse.(π / 2 .< :θ .< 3π / 2, :θ .+ π, :θ))
@transform(:evaM = log10.((60 * :eva_hrs_mission / median(60 * :eva_hrs_mission)) .+ offhr))
@transform(:xM = rPts * :evaM .* cos.(:θ), :yM = rPts * :evaM .* sin.(:θ))
@transform(:xMnm = rPts * (:evaM .- :total_number_of_missions .* :evaM ./ α) .* cos.(:θ))
@transform(:yMnm = rPts * (:evaM .- :total_number_of_missions .* :evaM ./ α) .* sin.(:θ))
end
valYear = @> begin
astro
@subset([true; :year_of_mission[2:end] .!= :year_of_mission[1:end-1]])
end
vehicles = @> begin
astro
@subset([true; :ascend_shuttle[2:end] .!= :ascend_shuttle[1:end-1]])
end
tierra = "https://eoimages.gsfc.nasa.gov/images/imagerecords/8000/8108/ipcc_bluemarble_west_front.jpg"
@suppress begin
global imgEarth
tierra = Downloads.download(tierra)
imgEarth = load(tierra)
imgEarth = imgEarth[:,120:end-120]
end
function getPoints(xi, yi, xf, yf)
xyos = []
for i in 1:length(xo)
push!(xyos, [xi[i], yi[i]])
push!(xyos, [xf[i], yf[i]])
end
xyos
end
x, y = astro.xM, astro.yM # end points
xs, ys = astro.xMnm, astro.yMnm # short lines starts
xo = yo = zeros(length(x)) # origin
xnb, ynb = 90 * cos.(astro.θ), 90 * sin.(astro.θ)
xne, yne = 100 * cos.(astro.θ), 100 * sin.(astro.θ)
ps, colorp = 0.5 .+ 3astro.ntotEVA, astro.total_eva_hrs # point size, color palette
gridLines = LinRange(log10(offhr), maximum(astro.evaM), 6)
horas = (10 .^ gridLines .- offhr) * median(60 * astro.eva_hrs_mission) / 60
xg = [rPts * gl .* cos.(astro.θ) for gl in gridLines]
yg = [rPts * gl .* sin.(astro.θ) for gl in gridLines]
# in order to use linesegments (faster to plot)
xyos = getPoints(xo, yo, xs, ys)
xys = getPoints(xs, ys, x, y)
xybe = getPoints(xnb, ynb, xne, yne)
cpDo = repeat(colorp, inner = 2)
psDo = repeat(ps, inner = 2)
with_theme(theme_black()) do
fig = Figure(size = (1200, 1200))
cmap = :rainbow2
ax = CairoMakie.Axis(fig[1, 1],
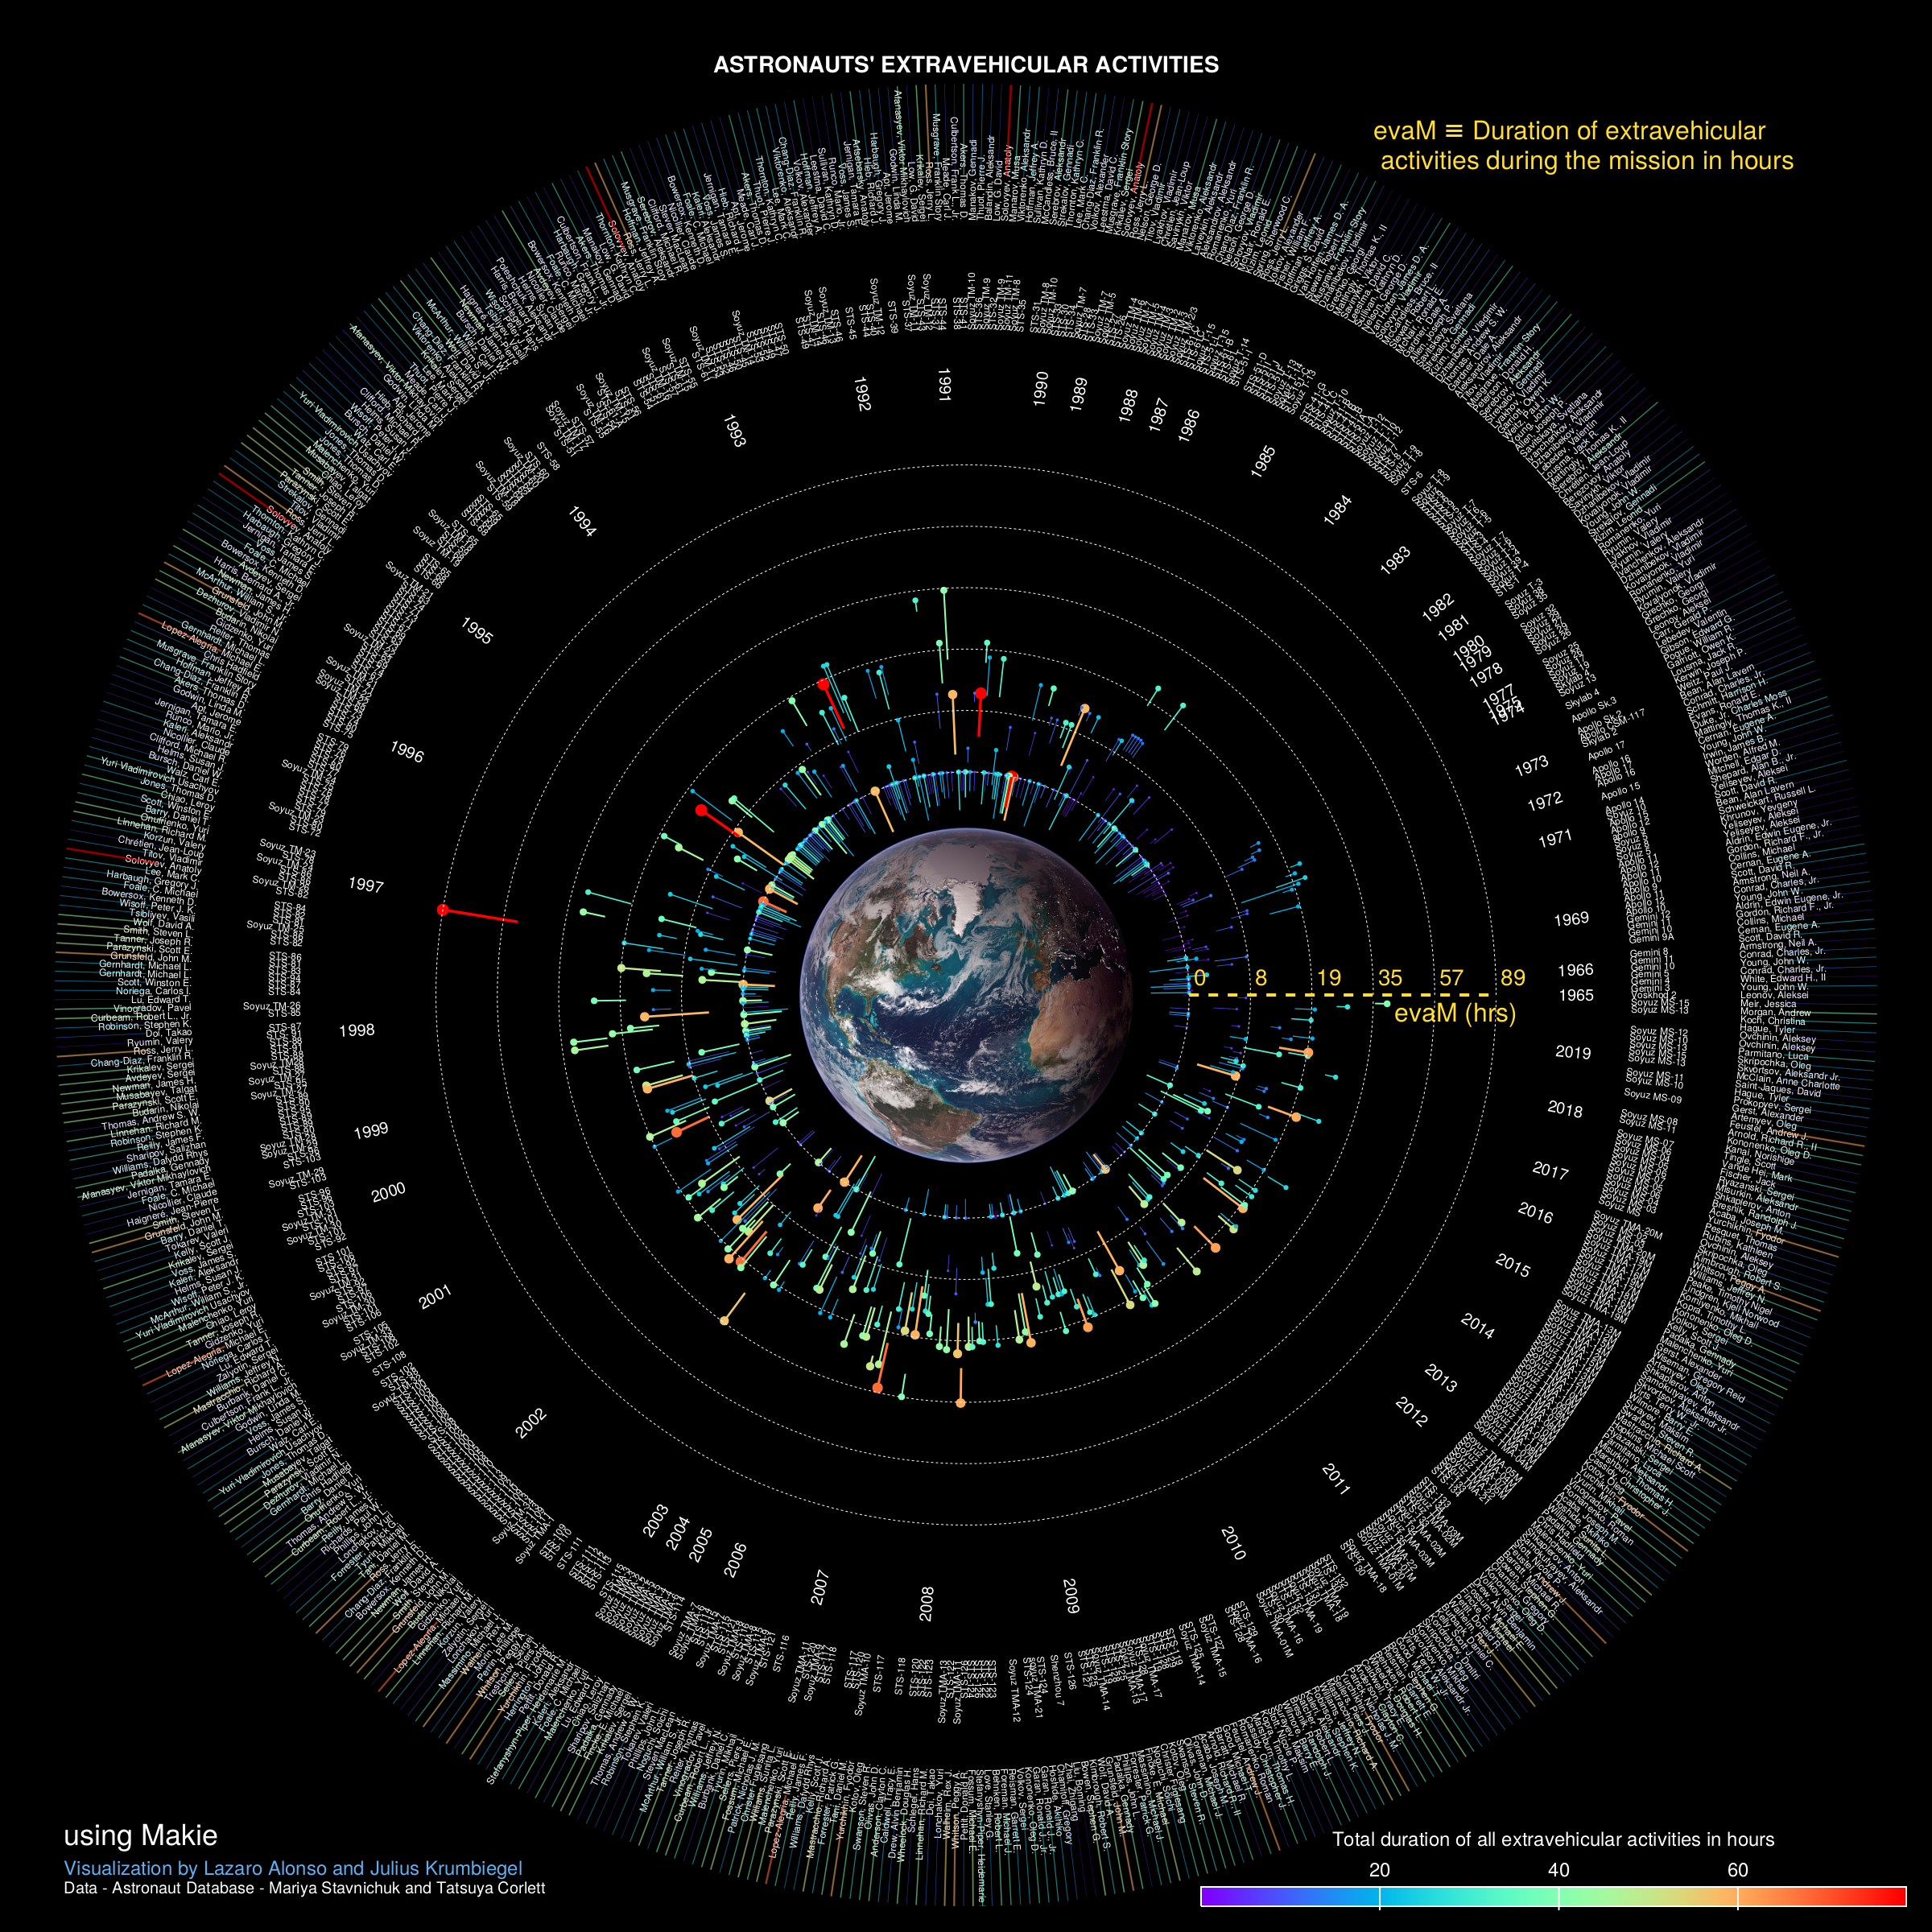
title = "ASTRONAUTS' EXTRAVEHICULAR ACTIVITIES",
autolimitaspect = 1)
hidespines!(ax)
hidedecorations!(ax)
image!(-20 .. 20, -20 .. 20, rotr90(imgEarth))
text!(astro.name, position = @.(Point2f(cos(astro.θ), sin(astro.θ)) * 85),
rotation = astro.texttheta, fontsize = 6, align = astro.align)
text!(string.(valYear.year_of_mission),
position = @.(Point2f(cos(valYear.θ), sin(valYear.θ)) * 65),
rotation = valYear.texttheta, fontsize = 10, align = valYear.align)
text!(vehicles.ascend_shuttle,
position = @.(Point2f(cos(vehicles.θ), sin(vehicles.θ)) * 73),
rotation = vehicles.texttheta, fontsize = 6, align = vehicles.align)
pltobj = scatter!(ax, astro[:, :xM], astro[:, :yM], color = colorp,
colormap = cmap, markersize = 3 * ps, strokewidth = 0)
linesegments!(Point2f.(xyos), color = cpDo, linewidth = psDo / 2, colormap = (cmap, 0.15))
linesegments!(Point2f.(xys), color = cpDo, linewidth = psDo / 2, colormap = cmap)
linesegments!(Point2f.(xybe), color = cpDo, linewidth = psDo / 3, colormap = (cmap, 0.5))
Colorbar(fig[1, 1], pltobj,
label = "Total duration of all extravehicular activities in hours",
tellheight = false, tellwidth = false, ticklabelsize = 12, flipaxis = true,
vertical = false, ticksize = 15, tickalign = 1, width = Relative(1.5 / 4),
halign = :right, valign = :bottom, labelsize = 12)
for (indx, gl) in enumerate(gridLines)
xg, yg = rPts * gl .* cos.(astro.θ), rPts * gl .* sin.(astro.θ)
hrs = Int64(round(horas[indx], digits = 0))
lines!(xg, yg, linewidth = 0.5, linestyle = :dash, color = :white)
text!(string.(hrs), position = (xg[1] + 0.5, y[1] + 0.5),
color = "#FFDD33", fontsize = 14)
end
lines!([rPts * gridLines[1], rPts * gridLines[end]], [0, 0], linestyle = :dash,
linewidth = 2, color = "#FFDD33")
text!("evaM (hrs)", position = (47, -3.5), color = "#FFDD33", fontsize = 16)
text!("evaM ≡ Duration of extravehicular \n activities during the mission in hours",
position = (rPts * gridLines[end-2], 90), color = "#FFDD33", fontsize = 16)
text!("using Makie", position = (-99, -94), fontsize = 18, color = :white)
text!("Visualization by Lazaro Alonso and Julius Krumbiegel ",
position = (-99, -97), fontsize = 12, color = "#61AFEF")
text!("Data - Astronaut Database - Mariya Stavnichuk and Tatsuya Corlett",
position = (-99, -99), fontsize = 10)
limits!(ax, -100, 100, -100, 100)
fig
end
end
fig = plotastro()