heatmap: scale crosshair
by @walra356
julia
using CairoMakie
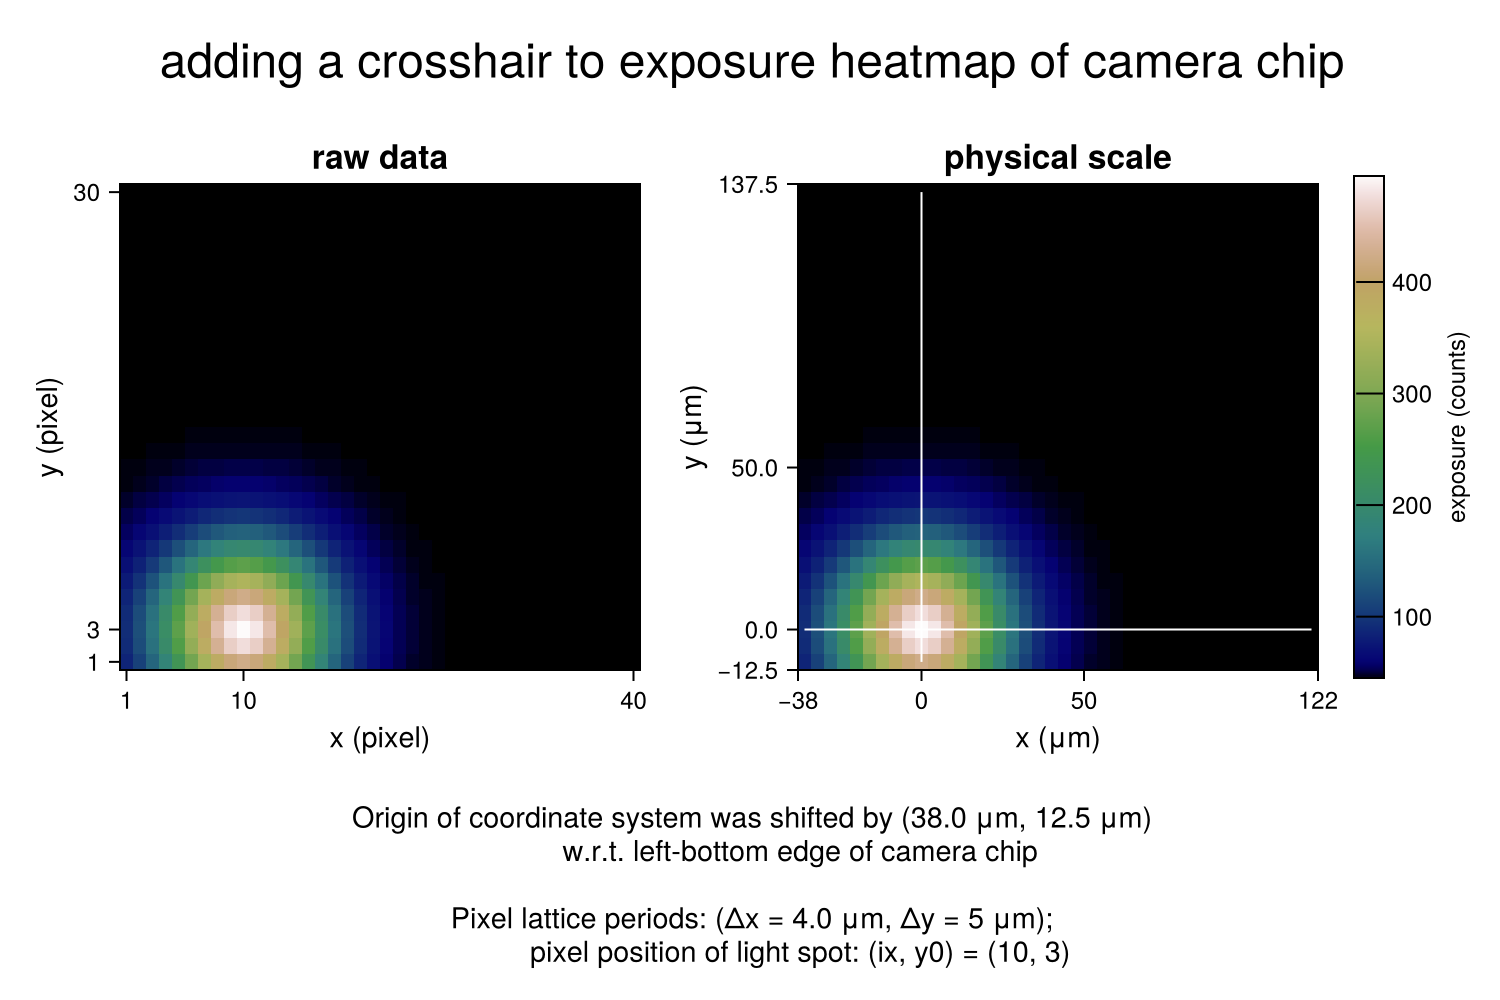
supertitle = "adding a crosshair to exposure heatmap of camera chip""adding a crosshair to exposure heatmap of camera chip"define transformation from pixel coordinates to physical coordinates
julia
edges(p, Δx, x0) = collect(p .* Δx) .- (x0 + 0.5Δx)edges (generic function with 1 method)parameters camera chip (pixel coordinates)
julia
dimX = 40
dimY = 30                        # pixel dimensions camera chip
(px, py) = (1:dimX, 1:dimY)                 # pixel positions
(ix, iy) = (10, 3)                          # selected pixel
(10, 3)physical coordinates
julia
(Δx, Δy) = (4.0, 5, 0)                       # pixel lattice periods (μm)
(Ox, Oy) = (edges(ix, Δx, 0), edges(iy, Δy, 0)) # manual offset (μm)
(x, y) = (edges(px, Δx, Ox), edges(py, Δy, Oy)) # pixel positions (μm)
([-36.0, -32.0, -28.0, -24.0, -20.0, -16.0, -12.0, -8.0, -4.0, 0.0 … 84.0, 88.0, 92.0, 96.0, 100.0, 104.0, 108.0, 112.0, 116.0, 120.0], [-10.0, -5.0, 0.0, 5.0, 10.0, 15.0, 20.0, 25.0, 30.0, 35.0 … 90.0, 95.0, 100.0, 105.0, 110.0, 115.0, 120.0, 125.0, 130.0, 135.0])create exposure matrix σ (model alternative for measurement file)
julia
valmax = 500.0                              # maximum value exposure matrix
exposure(i, j, ix, iy, wx, wy) = 0.9valmax *
                                  (exp(-(((i - ix) / wx)^2 + ((Δy / Δx) * (j - iy) / wy)^2)) + 0.1)
σ = round.(Int, [exposure(i, j, ix, iy, 6, 6) for i = 1:dimX, j = 1:dimY])
σ = σ[px, py]                                # exposure matrix
footnote = "Origin of coordinate system was shifted by ($Ox μm, $Oy μm)
            w.r.t. left-bottom edge of camera chip
            \nPixel lattice periods: (Δx = $Δx μm, Δy = $Δy μm);
            pixel position of light spot: (ix, y0) = ($(ix), $(iy))"
"Origin of coordinate system was shifted by (38.0 μm, 12.5 μm)\n w.r.t. left-bottom edge of camera chip\n \nPixel lattice periods: (Δx = 4.0 μm, Δy = 5 μm);\n pixel position of light spot: (ix, y0) = (10, 3)"start actual plot
julia
theme = Theme(fontsize = 12, colormap = :gist_earth, ; size = (750, 500))
set_theme!(theme)
fig = Figure()
collect attributes
julia
fsize = fig.scene.theme.fontsize.val
attr = (xlabelsize = 6fsize / 5, ylabelsize = 6fsize / 5, titlesize = 7fsize / 5,
  xautolimitmargin = (0, 0), yautolimitmargin = (0, 0),)
attr1 = (attr..., title = "raw data",
  xticks = [px[1], ix, px[end]], yticks = [py[1], iy, py[end]],
  xlabel = "x (pixel)", ylabel = "y (pixel)",
  aspect = (Δx * size(σ, 1)) / (Δy * size(σ, 2)),)
attr2 = (attr..., title = "physical scale",
  xticks = [x[1] - Δx / 2, x[ix], 50, x[end] + Δx / 2],
  yticks = [y[1] - Δy / 2, y[iy], 50, y[end] + Δy / 2],
  xlabel = "x (μm)", ylabel = "y (μm)",
  aspect = (Δx * size(σ, 1)) / (Δy * size(σ, 2)),)
attrc = (label = "exposure (counts)", ticksize = 6fsize / 5, tickalign = 1,
  width = 15, height = Relative(0.98),) # tweaked
(label = "exposure (counts)", ticksize = 14.4, tickalign = 1, width = 15, height = Relative(0.98f0))create axes, add contents
julia
ax1 = Axis(fig; attr1...)
ax2 = Axis(fig; attr2...)
hm1 = heatmap!(ax1, px, py, σ)
hm2 = heatmap!(ax2, x, y, σ)
axc = Colorbar(fig, hm1; attrc...)
axn = Label(fig, text = footnote, fontsize = 6fsize / 5)
axt = Label(fig, text = supertitle, fontsize = 2fsize)
lnh = lines!(ax2, x, fill(0, length(x)), color = :white, linewidth = 1)
lnv = lines!(ax2, fill(0, length(y)), y, color = :white, linewidth = 1)
Lines{Tuple{Vector{Point{2, Float64}}}}create layout and show figure
julia
fig[1, 1] = ax1
fig[1, 2] = ax2
fig[1, 3] = axc
fig[2, :] = axn
fig[0, :] = axt
fig