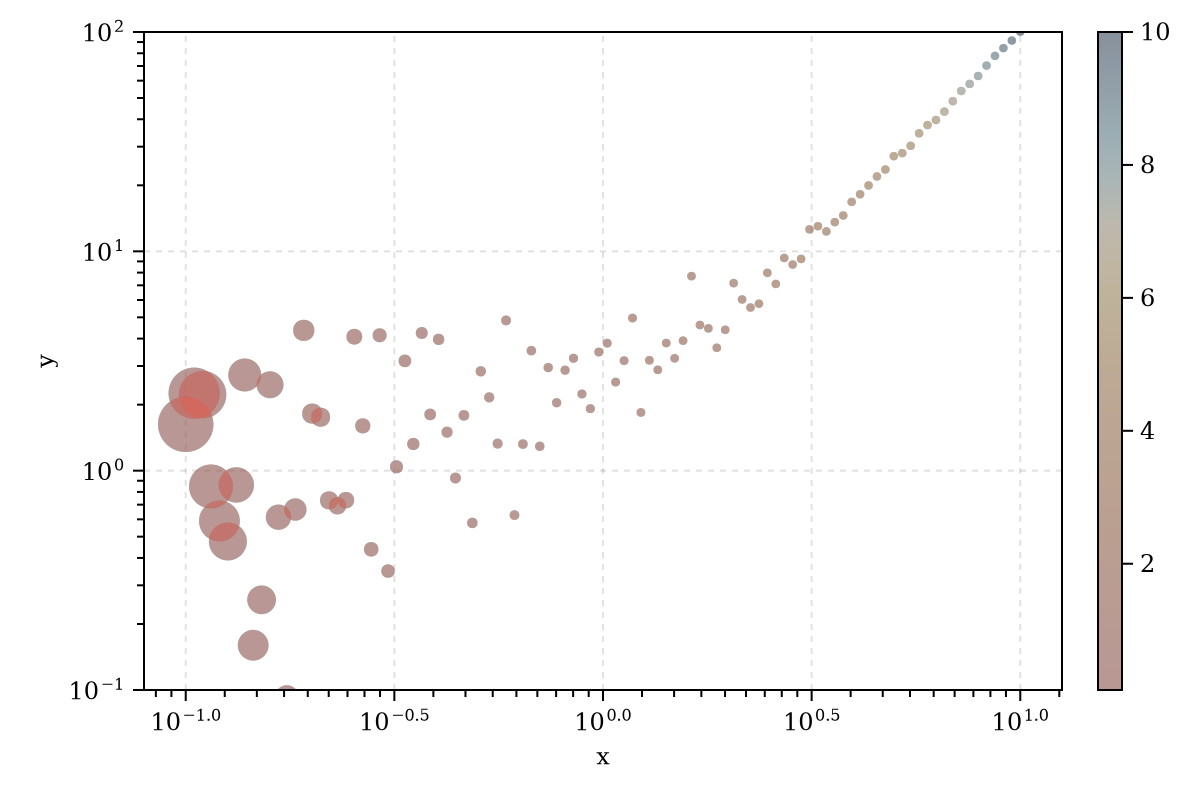
bubble plot: scatters in x and y log scale

julia
using CairoMakie, Random, Colors

Random.seed!(123)
x = 10 .^ (range(-1, stop=1, length=100))
y = x .^ 2 .+ abs.(2 * randn(length(x)))
cmap = cgrad(:Hiroshige, scale=:log, alpha=0.5)

fig, ax, pltpbj = scatter(x, y; markersize=(x .^ 2/3)[end:-1:1] .+ 6,
    color=x, colormap=cmap,
    figure=(;
        size=(600, 400),
        fonts=(;regular="CMU Serif"),
        backgroundcolor=:transparent),
    axis=(;
        backgroundcolor=:transparent,
        xscale=log10,
        yscale=log10,
        xlabel="x", ylabel="y",
        xgridstyle=:dash,
        ygridstyle=:dash,
        xminorticksvisible=true,
        yminorticksvisible=true,
        xminorticks=IntervalsBetween(9),
        yminorticks=IntervalsBetween(9)))
Colorbar(fig[1, 2], pltpbj)
ylims!(ax, 1e-1, 1e2)
fig