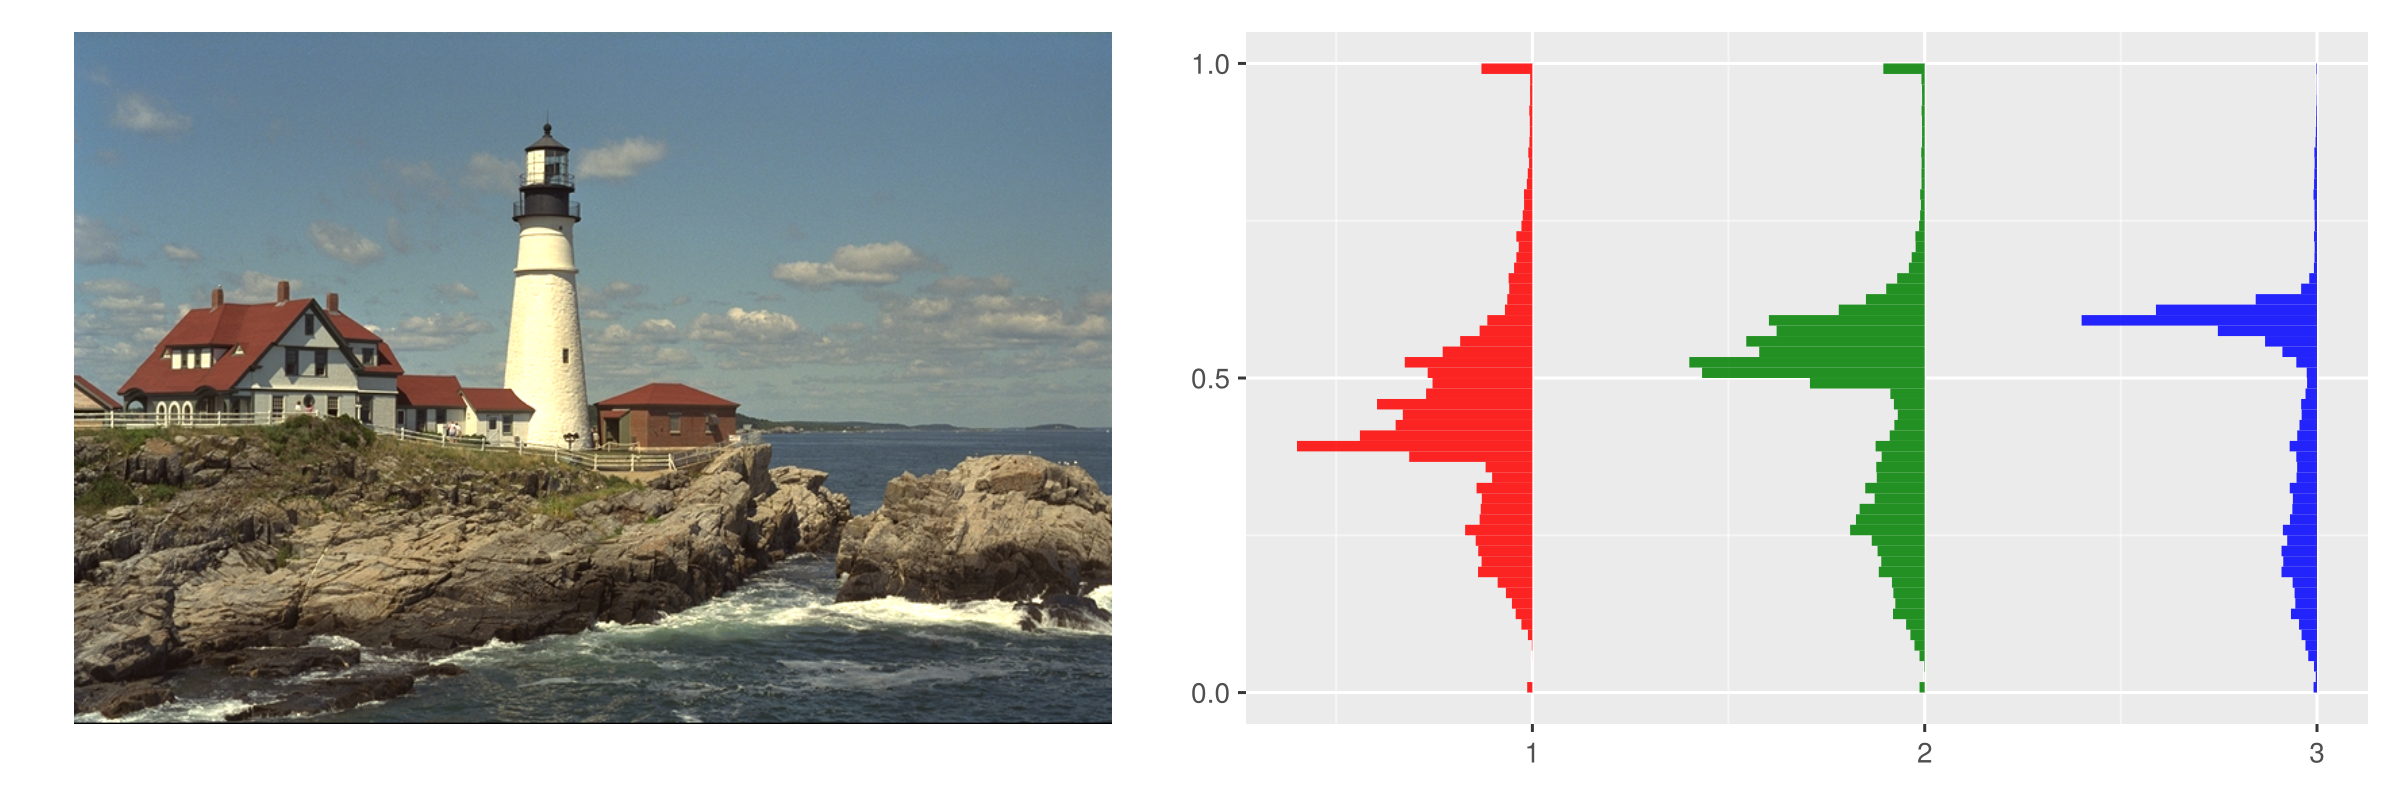
Histograms r,g,b colors on image

julia
using CairoMakie
import TestImages
using Colors

# example by @cormullion
function  image_histogram()
    img = TestImages.testimage("lighthouse")
    reds = vec(float.(red.(img)))
    greens = vec(float.(green.(img)))
    blues = vec(float.(blue.(img)))

    fig = Figure(; size = (1200,400))
    ax1 = Axis(fig[1, 1], aspect = DataAspect())
    ax2 = Axis(fig[1, 2])
    for (i, col) = enumerate([:red, :green, :blue])
        hist!(ax2, (reds, greens, blues)[i];
            scale_to=-0.6,
            bins=60,
            offset=i,
            direction=:x,
            color=(col, 0.85)
            )
    end
    image!(ax1, rotr90(img))
    hidedecorations!(ax1)
    hidespines!(ax1)
    fig
end

fig = with_theme(image_histogram, theme_ggplot2())
Downloading artifact: images